- Joined
- Oct 19, 2024
Jason "Thor" Hall / PirateSoftware / Maldavius Figtree

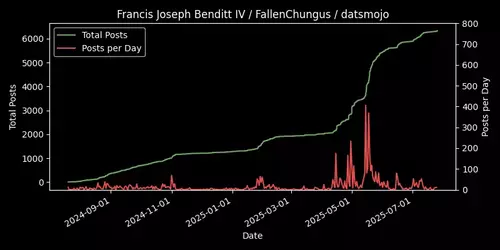
Francis Joseph Benditt IV / FallenChungus / datsmojo
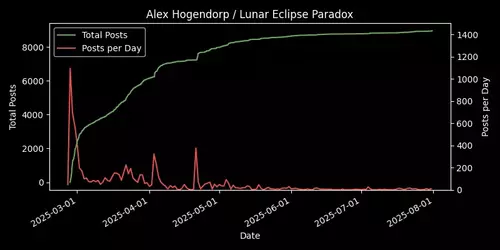
Alex Hogendorp / Lunar Eclipse Paradox
Troonslop "Retro" Games

Elon Reeve Musk

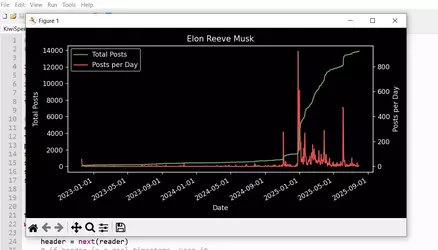
Introducing KiwiSpeed, a pair of Python scripts that can scrape a thread then make a cool chart of how fast the thread has moved. KiwiSpeedScraper.py steps through every page of a thread, collects the timestamps of every post, then saves them to a CSV file. KiwiSpeedChart.py reads that CSV file, then makes the PyPlot chart you see above.
HOW TO USE
1. Open your IDE of choice, and paste the code above into their own scripts. (Unfortunately for you CLIheads out there, these won't work from the command line.)
2. Go to the thread you want to chart, paste the link of its first page into

3. Run the code. You should start seeing this in the print area:
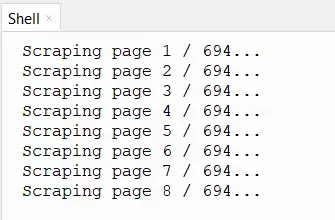
It will prompt you once it's finished and the CSV has been generated. The CSV will appear in the same directory as this script.

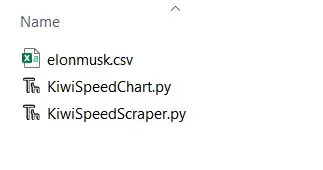
4. Open KiwiSpeedChart.py. Set
For

5. Run the code, and the chart(s) will appear in a new window. Use the Save icon to save it as a PNG.
Try it out! See how fast your favorite cow's thread moves!

Francis Joseph Benditt IV / FallenChungus / datsmojo

Alex Hogendorp / Lunar Eclipse Paradox

Troonslop "Retro" Games

Elon Reeve Musk

Introducing KiwiSpeed, a pair of Python scripts that can scrape a thread then make a cool chart of how fast the thread has moved. KiwiSpeedScraper.py steps through every page of a thread, collects the timestamps of every post, then saves them to a CSV file. KiwiSpeedChart.py reads that CSV file, then makes the PyPlot chart you see above.
Python:
# KIWISPEED SCRAPER
# Created by: my penis is on fire

import requests
from html.parser import HTMLParser
from datetime import datetime
import csv

## SETTINGS ##
thread_url = "https://kiwifarms.st/threads/elon-reeve-musk.134949/" # URL of Page 1 of thread to capture
pages = 694 # Number of pages this thread has
filename = "elonmusk.csv" # Name of output file (Must end in .csv)


class TimestampParser(HTMLParser):

    def __init__(self):
        super().__init__()
        self.timestamps = []
        self._in_lastedit = False
        self._in_embed = False
        self._embed_depth = 0

    def handle_starttag(self, tag, attrs):
        tag = tag.lower()
        attr_dict = {name.lower(): val for name, val in attrs}

        # Entering "last edited" block?
        if tag == 'div' and 'class' in attr_dict and 'message-lastEdit' in attr_dict['class']:
            self._in_lastedit = True
            return

        # Entering an embed block?
        if tag == 'div' and 'class' in attr_dict and 'fauxBlockLink' in attr_dict['class']:
            self._in_embed = True
            self._embed_depth = 1
            return

        # If already inside an embed, track nested divs
        if self._in_embed and tag == 'div':
            self._embed_depth += 1
            return

        # Parse <time> if not in an edit or embed
        if tag == 'time' and not self._in_lastedit and not self._in_embed:
            ts = None
            if 'title' in attr_dict:
                ts = attr_dict['title'].replace(',', '')
            # Parse ISO datetime and reformat for csv
            elif 'datetime' in attr_dict:
                iso = attr_dict['datetime']
                try:
                    dt = datetime.fromisoformat(iso)
                    ts = dt.strftime('%b %d %Y at %I:%M %p').replace(' 0', ' ')
                except ValueError:
                    ts = iso
            if ts:
                self.timestamps.append(ts)

    def handle_endtag(self, tag):
        tag = tag.lower()
        # Exiting embed blocks?
        if tag == 'div' and self._in_embed:
            self._embed_depth -= 1
            if self._embed_depth == 0:
                self._in_embed = False
            return

        # Exiting last‑edit block?
        if tag == 'div' and self._in_lastedit:
            self._in_lastedit = False

def get_timestamps_from_page(url):
    resp = requests.get(url)
    resp.raise_for_status()
    parser = TimestampParser()
    parser.feed(resp.text)
    return parser.timestamps[1:] # Removes first timestamp of when the OP was made

if __name__ == '__main__':
    all_stamps = []
    current_page = 1
    while current_page <= pages:
        try:
            print("Scraping page " + str(current_page) + " / " + str(pages) + "...")
            stamps = get_timestamps_from_page(thread_url + "page-" + str(current_page))
            if stamps:
                all_stamps.extend(stamps)
            else:
                print("No valid timestamps found on that page.")
            current_page += 1

        except requests.RequestException as e:
            print(f"Error fetching page: {e}")
    #print(all_stamps)

    with open(filename, 'w', newline='') as csvfile:
        csv_writer = csv.writer(csvfile)
        csv_writer.writerows([[ts] for ts in all_stamps])
    print(f"Data saved to {filename}")
Python:
# KIWISPEED CHART MAKER
# Created by: my penis is on fire

import csv
from datetime import datetime, timedelta
import matplotlib.pyplot as plt
import matplotlib.dates as mdates
from collections import Counter, OrderedDict

## SETTINGS ##
csv_filename = "elonmusk.csv" # csv must be in same directory as this script
final_plot_title = "Elon Reeve Musk"
ppd_ylim = 0 # Adjust height of Posts Per Day line. Set to 0 to auto-set.
show_cumulative = False # Optional individual charts.
show_per_day = False
show_per_week = False
show_per_month = False


timestamps = []
with open(csv_filename, newline='') as f:
    reader = csv.reader(f)
    header = next(reader)
    try:
        datetime.strptime(header[0], '%b %d %Y at %I:%M %p')
    except ValueError:
        pass
    else:
        timestamps.append(header[0])
    for row in reader:
        if row:
            timestamps.append(row[0])

dt_list = [datetime.strptime(ts, '%b %d %Y at %I:%M %p') for ts in timestamps]
dt_list.sort()

times = dt_list
counts = list(range(1, len(times) + 1))

plt.style.use('dark_background')
if show_cumulative:
    fig, ax = plt.subplots()
    ax.step(times, counts, where='post', color = "#6BA65E")
    ax.set_title('Cumulative Posts Over Time')
    ax.set_xlabel('Time')
    ax.set_ylabel('Posts')
    ax.xaxis.set_major_formatter(mdates.DateFormatter('%Y-%m-%d'))
    #plt.yscale('log')
    fig.autofmt_xdate()
    plt.tight_layout()


# Aggregate to weeks, months
def aggregate_counts(dt_list, freq):
    buckets = []
    for dt in dt_list:
        if freq == 'D':
            bucket = datetime(dt.year, dt.month, dt.day)
        elif freq == 'W':
            start = dt - timedelta(days=dt.weekday())  # Monday
            bucket = datetime(start.year, start.month, start.day)
        elif freq == 'M':
            bucket = datetime(dt.year, dt.month, 1)
        else:
            raise ValueError("freq must be one of 'D','W','M'")
        buckets.append(bucket)

    if not buckets:
        return OrderedDict()

    ctr = Counter(buckets)

    min_bucket = min(buckets)
    max_bucket = max(buckets)
    periods = []

    if freq == 'D':
        delta = timedelta(days=1)
        current = min_bucket
        while current <= max_bucket:
            periods.append(current)
            current += delta

    elif freq == 'W':
        delta = timedelta(weeks=1)
        current = min_bucket
        while current <= max_bucket:
            periods.append(current)
            current += delta

    elif freq == 'M':
        current = min_bucket
        while current <= max_bucket:
            periods.append(current)
            year = current.year + (current.month // 12)
            month = current.month % 12 + 1
            current = datetime(year, month, 1)

    ordered = OrderedDict((p, ctr.get(p, 0)) for p in periods)
    return ordered


daily = aggregate_counts(dt_list, 'D')
if show_per_day:
    fig, ax = plt.subplots()
    ax.plot(list(daily.keys()), list(daily.values()), marker='', color = "#6BA65E")
    ax.set_title('Posts per Day')
    ax.set_xlabel('Date')
    ax.set_ylabel('Posts per Day')
    ax.xaxis.set_major_formatter(mdates.DateFormatter('%Y-%m-%d'))
    fig.autofmt_xdate()
    plt.tight_layout()

weekly = aggregate_counts(dt_list, 'W')
if show_per_week:
    fig, ax = plt.subplots()
    ax.plot(list(weekly.keys()), list(weekly.values()), marker='', color = "#6BA65E")
    ax.set_title('Posts per Week')
    ax.set_xlabel('Week Starting')
    ax.set_ylabel('Posts per Week')
    ax.xaxis.set_major_formatter(mdates.DateFormatter('%Y-%m-%d'))
    fig.autofmt_xdate()
    plt.tight_layout()

monthly = aggregate_counts(dt_list, 'M')
if show_per_month:
    fig, ax = plt.subplots()
    ax.plot(list(monthly.keys()), list(monthly.values()), marker='', color = "#6BA65E")
    ax.set_title('Posts per Month')
    ax.set_xlabel('Month')
    ax.set_ylabel('Count')
    ax.xaxis.set_major_formatter(mdates.DateFormatter('%Y-%m'))
    fig.autofmt_xdate()
    plt.tight_layout()

fig, ax1 = plt.subplots(figsize=(8,4))
ax2 = ax1.twinx()

ax1.set_zorder(ax2.get_zorder() + 1)
ax1.patch.set_visible(False)

ax2.plot(
    list(daily.keys()), list(daily.values()), label='Posts per Day', color="#E54C4C", zorder=1)
ax2.set_ylabel('Posts per Day')
ax2.tick_params(axis='y')
if ppd_ylim != 0: ax2.set_ylim(0, ppd_ylim)
#ax2.set_yscale('log')

ax1.step(times, counts, where='post', label='Total Posts', color="#6BA65E", zorder=2)
ax1.set_xlabel('Date')
ax1.set_ylabel('Total Posts')
ax1.xaxis.set_major_formatter(mdates.DateFormatter('%Y-%m-%d'))
ax1.tick_params(axis='y')
#ax1.set_yscale('log')

lines1, labels1 = ax1.get_legend_handles_labels()
lines2, labels2 = ax2.get_legend_handles_labels()
ax1.legend(lines1 + lines2, labels1 + labels2, loc='upper left')

fig.autofmt_xdate()
plt.title(final_plot_title)
plt.tight_layout()
plt.show()
HOW TO USE
1. Open your IDE of choice, and paste the code above into their own scripts. (Unfortunately for you CLIheads out there, these won't work from the command line.)
2. Go to the thread you want to chart, paste the link of its first page into
thread_url, enter the number of pages it has into pages, and set the output file name with filename.
3. Run the code. You should start seeing this in the print area:

It will prompt you once it's finished and the CSV has been generated. The CSV will appear in the same directory as this script.


4. Open KiwiSpeedChart.py. Set
csv_filename to the name of the csv you just generated, and set final_plot_title to what you want the chart title to be. ppd_ylim lets you adjust the height of the Posts per Day line, setting this higher will make the line shorter. Leave it as 0 and PyPlot will auto-set the height. I made this a setting so you can prevent the PPD line from overlapping with the Total Posts line too much. For
show_cumulative, show_per_day, show_per_week, and show_per_month, setting any of those to True will generate an extra line chart that shows cumulative total posts or posts per day, week, or month. 
5. Run the code, and the chart(s) will appear in a new window. Use the Save icon to save it as a PNG.

Try it out! See how fast your favorite cow's thread moves!

 do USPG2


